Introduction
Potential levels in the ocean are determined by a variety of factors, including the level of Chlorophyll-a, Sea Surface Temperature, Total Suspended Solids, and Sea Surface Salinity. Chlorophyll-a is an important indicator of the health of a marine ecosystem, as its presence indicates the availability of nutrients for photosynthesis. Sea Surface Temperature is an important factor in determining the overall health of an ocean, as it can influence the movement of ocean currents and the availability of nutrients in the water. Total Suspended Solids measure the amount of suspended particles in the water, which can be a sign of pollution or other environmental issues. Lastly, Sea Surface Salinity measures the saltiness of the water, which can indicate the presence of other minerals in the water and have an impact on the ocean's overall health. All of these factors must be assessed to determine the potential levels in the ocean.
Keyword : Potential Fishing Zone, Chlorophyll-a, Sea Surface Temperature, Sea Surface Salinity, Total Suspended Solids
Basic Analysis
Basic analysis is use for simple detection of potential fishing zone. The potential fishing zone will generated from Landsat 8 data collection with custom date range. For the result, there will shown a suitability index value in layout map with higher value mean more high potential fish at there.
UI Description
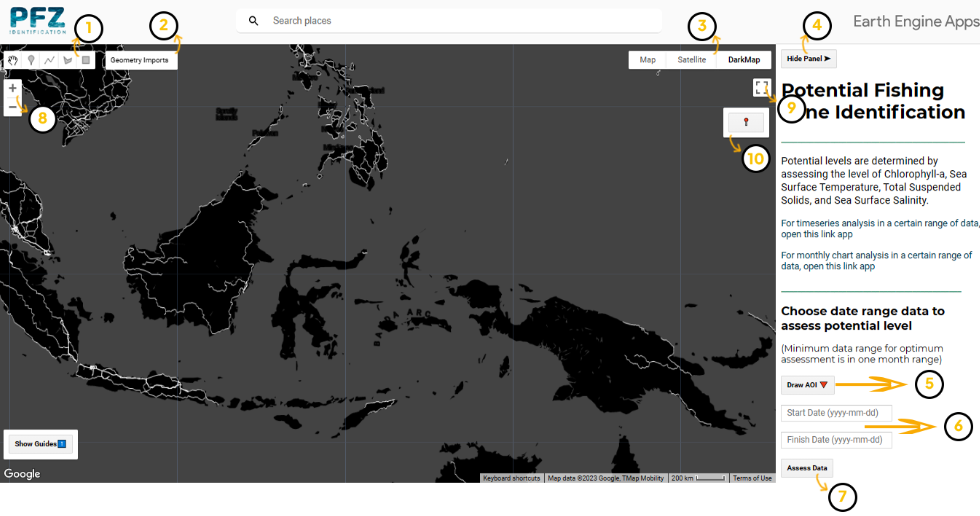
1. Drawing Tool
Tool for drawing or making your Area of Interest (AOI)
2. Geometry Layer
Panel for managing your drawn AOI/geometry such as showing, hiding, and deleting geometry
3. Basemap Layer
Panel for choosing your preferable basemap
4. Show/Hide Button
Button to show/hide main panel
5. Draw AOI Button
Button to open AOI Drawing Tool in the main panel
6. Data Range Input-box
Box for adding data range input
7. Assess Button
Button to start assessing data based on your input data range
8. Zoom In/Out Tool
Tool for zooming in and out the map canvas
9. Fullscreen Button
Button for viewing map canvas in fullscreen mode
10. User Location Tool
Tool for showing your location
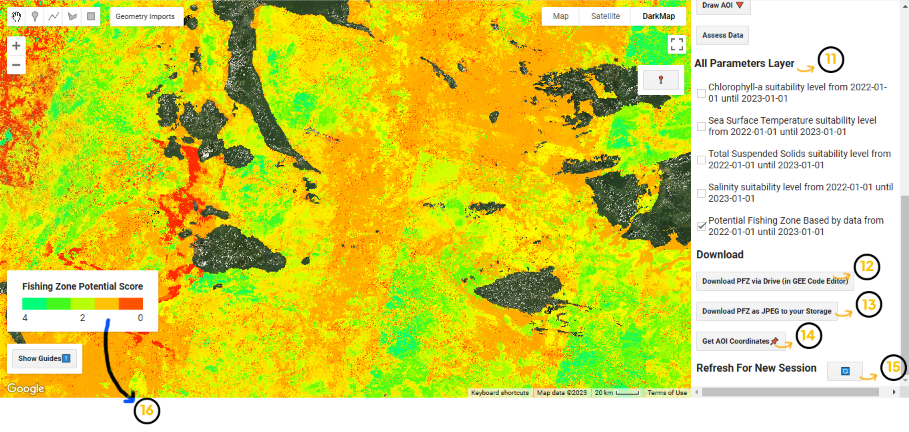
11. Layer Panel
Panel for showing and hiding assessment result layer
12. Drive Download Button
Button to download data via Google Drive (can only be used in GEE Code Editor)
13. User Download Button
Button to download data with *.JPEG format
14. AOI Coordinates Button
Button to get every coordinates of your AOI in the main panel
15. Refresh Panel Button
Button to refresh all main panel and start assessing different data
16. Legend Panel
Panel to know the meaning of the colors in the shown image
Start Assessing
PFZ Assessment are done by your drawn AOI and data range input. The steps for doing so are explained below
A. Draw AOI
Draw or make your Area Of Interest (AOI) in the map canvas to your preferrable area
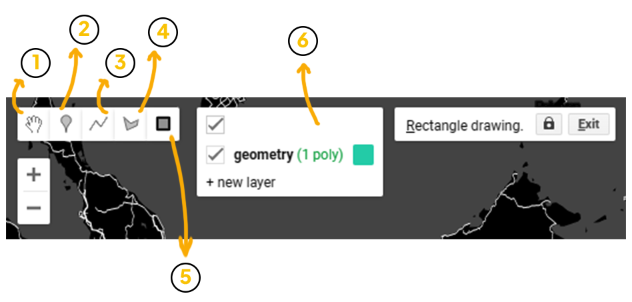
Drawing Tool Description
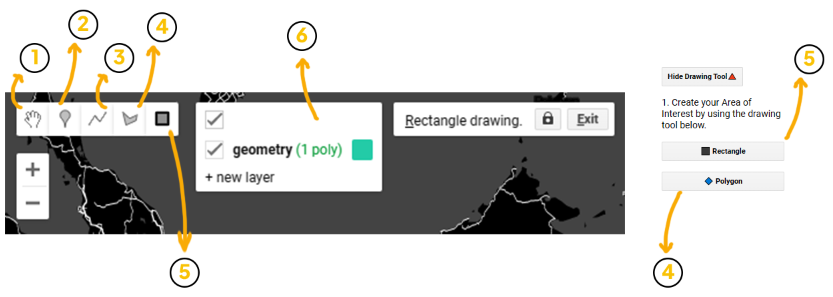
1. Pan Tool
Geometry tool for dragging map view and select geometry on the map
2. Point Tool
Geometry tool for making a Point of Interest (POI)
3. Line Tool
Geometry tool for makina a line geometry (not so much used in the app)
4. Polygon Tool
Geometry tool for making an AOI with polygon-shaped
5. Rectangular Tool
Geometry tool for making an AOI with rectangular-shaped
6. Geometry Layer Panel
Panel for managing geometry layer such as showing/hiding/deleting geometry
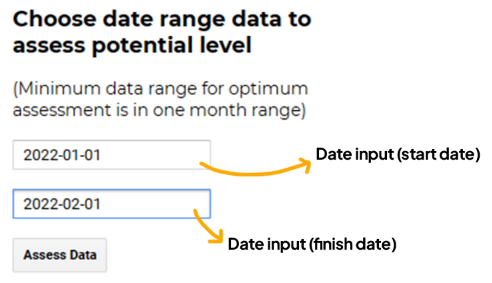
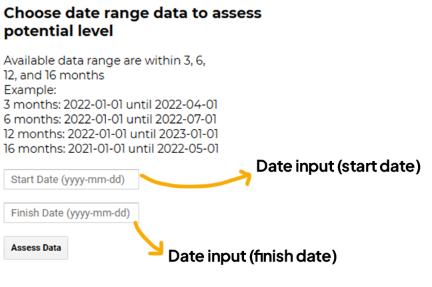
B. Input Range and Assess
Range are added in the date input box and the data between those range are assessed when Assess Data button's clicked
Notes:
> Date format is in YYYY-MM-DD.
> Assessment's result is much more valid if your data range is in a month until a year
C. Assessing Again (Optional)
1. Move or delete your AOI using Pan Tool
2. Make or draw your AOI again in your preferable area
3. Choose Refresh Panel Button in the main panel
4. Input your new data range if needed and choose Assess Data Button
Download Data as image
PFZ assessment result can be downloaded into *.JPEG format and *.TIFF format. *.TIFF format can be downloaded in your Google Drive if you have the code editor link.
Note:
Your data can only be downloaded if your AOI isn't too large. If your AOI's too large, download may occur error.
Download Data as TIFF
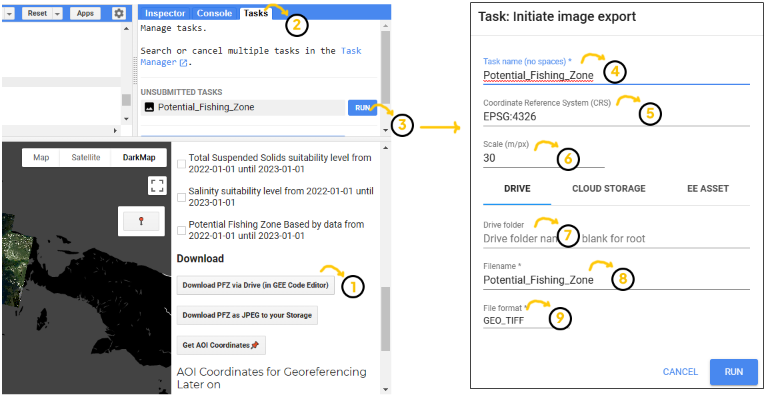
1. Download Button
Click this button if you want to download the PFZ data inside your AOI. This button will generate the download task in Task Window.
2. Task Window
The Download task will appear in here. You can manage your all download task in here.
3. Run Task Button
This button will running your download task into your Drive.
4. Task Name
Description about the download task
5. CRS Identification
This text box define the Coordinates Reference System of the PFZ data. The default CRS is 'EPSG:4326' (World Geodetic System 1984).
6. Scale
The pixel scale of the PFZ data in meters/pixels. Because of the imagery data from LANDSAT 8, the default value is 30.
7. Download Location
Download location path in Drive. If the text field is left blank, the downloaded file will placed in root.
8. File Name
Create your download file name in here.
9. File Format
This field use for define the file format (default format is GEO_TIFF).
Get AOI Coordinates
> AOI coordinates are extracted in main panel by clicking the AOI Coordinates Button.
> All coordinates can be used for georeferencing your downloaded data in *.JPEG format
> Georeferencing can be done in GIS Softwares such as QGIS and ArcGIS
Time Series Analysis
Timeseries analysis application version is used for advance analysis to get a temporal information of the PFZ distribution. The PFZ is also generated from USGS Landsat 8 Surface Reflectance data collection in custom range within 3, 6, 12, or 16 months depends on your date range input. The timeseries will be shown as a GIF-based animation and can be downloaded for further analysis outside the app.
UI Description
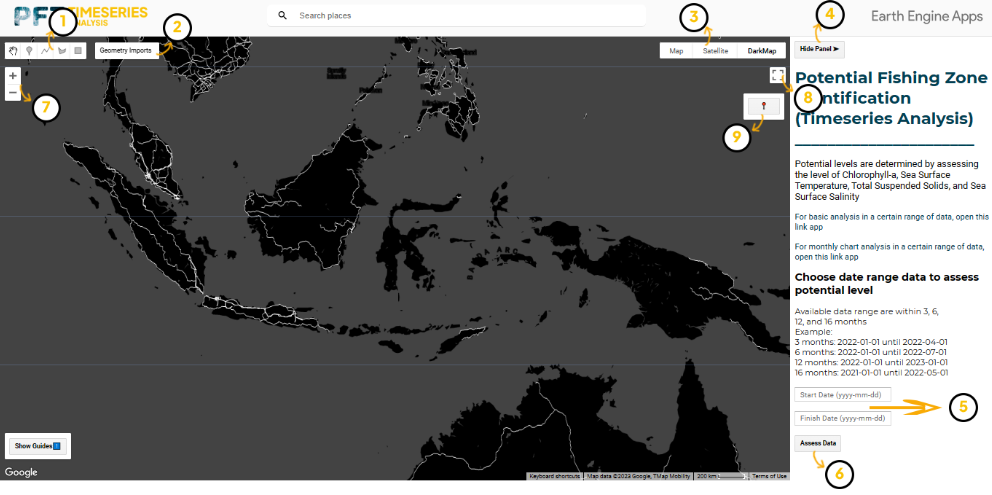
1. Drawing Tool
Tool for drawing or making your Area of Interest (AOI)
2. Geometry Layer
Panel for managing your drawn AOI/geometry such as showing, hiding, and deleting geometry
3. Basemap Layer
Panel for choosing your preferable basemap
4. Show/Hide Button
Button to show/hide main panel
5. Data Range Input-box
Box for adding data range input
6. Assess Button
Button to start assessing data based on your input data range
7. Zoom In/Out Tool
Tool for zooming in and out the map canvas
8. Fullscreen Button
Button for viewing map canvas in fullscreen mode
9. User Location Tool
Tool for showing your location
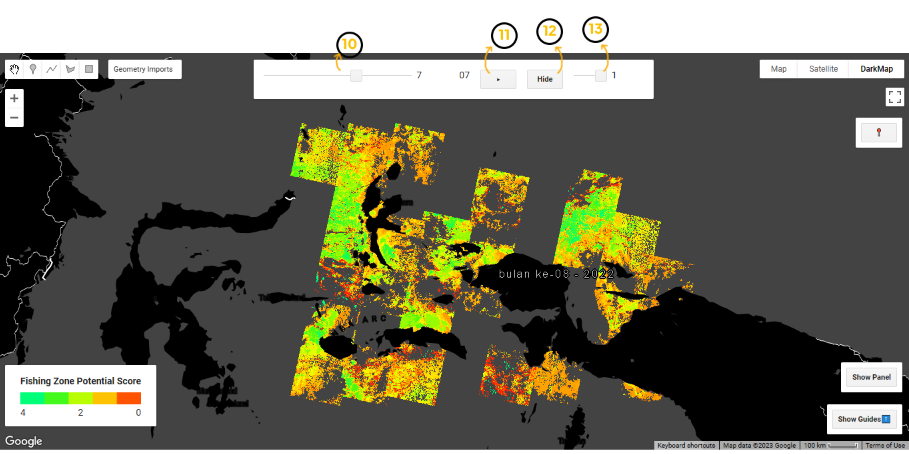
10. Frame Slider Tool
Tool for sliding frames to other frames
11. Play/Pause Button
Button to play the animation in map canvas
12. Hide Button
Button to hide and show animation layer
13. Opacity Slider Tool
Tool for setting animation layer's opacity
Start Assessing
A. Draw AOI
Draw or make your Area Of Interest (AOI) in the map canvas to your preferrable area
Drawing Tool Description
1. Pan Tool
Geometry tool for dragging map view and select geometry on the map
2. Point Tool
Geometry tool for making a Point of Interest (POI)
3. Line Tool
Geometry tool for makina a line geometry (not so much used in the app)
4. Polygon Tool
Geometry tool for making an AOI with polygon-shaped
5. Rectangular Tool
Geometry tool for making an AOI with rectangular-shaped
6. Geometry Layer Panel
Panel for managing geometry layer such as showing/hiding/deleting geometry
B. Input Range and Assess
Range are added in the date input box and the data between those range are assessed when Assess Data button's clicked
Notes:
>Date format is in YYYY-MM-DD.
>Timeseries animation can only be shown if your date range is in 3, 6, 12, and 16 months.
C. Assessing Again (Optional)
1. Move or delete your AOI using Pan Tool
2. Make or draw your AOI again in your preferable area
3. Choose Refresh Panel Button in the main panel
4. Input your new data range if needed and choose Assess Data Button
Download Data as GIF
PFZ timeseries animation can be downloaded as *.GIF format by clicking the download button
Monthly Chart Analysis
Monthly Chart Analysis application version is used for advance analysis to know the seasonality of PFZ in certain area and time. The analysis can be done by using the Monthly PFZ Suitability Score Index Chart and Harmonized Monthly PFZ Suitability Score Index over an area and a certain pixel. The PFZ is also generated from USGS Landsat 8 Surface Reflectance data collection in custom range within 3, 6, 12, 16, and 24 months depends on your date range input.
UI Description
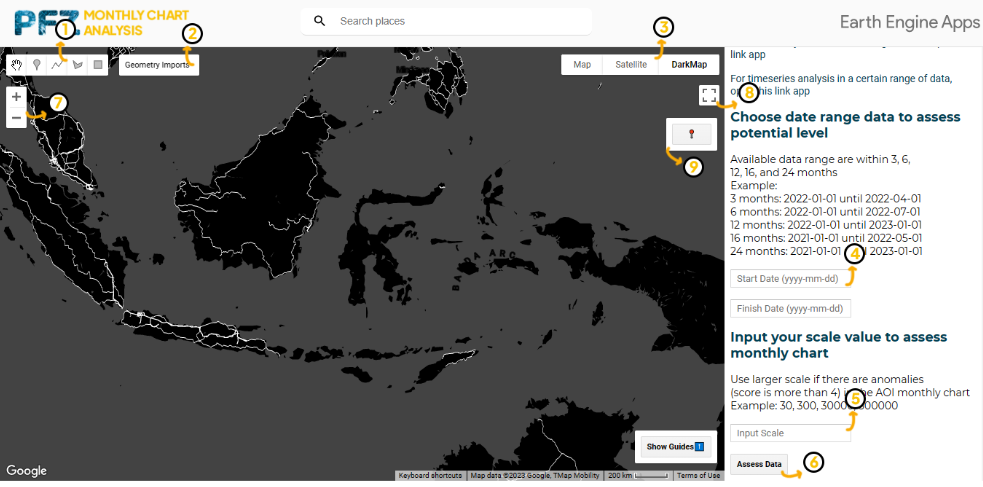
1. Drawing Tool
Tool for drawing or making your Area of Interest (AOI)
2. Geometry Layer
Panel for managing your drawn AOI/geometry such as showing, hiding, and deleting geometry
3. Basemap Layer
Panel for choosing your preferable basemap
4. Data Range Input-box
Box for adding data range input
5. Scale Input-box
Box for adding scale input
6. Assess Button
Button to start assessing data based on your input data range
7. Zoom In/Out Tool
Tool for zoom in and out the map canvas
8. Fullscreen Button
Button for viewing map canvas in fullscreen mode
9. User Location Tool
Tool for showing your location
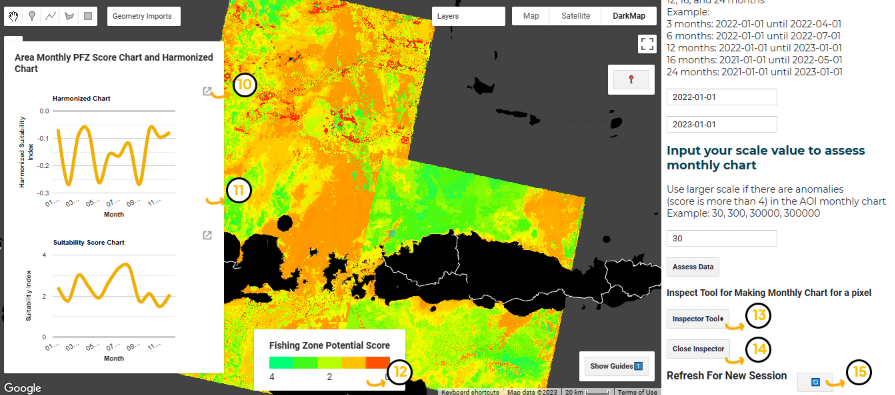
10. Download Chart Tool
Tool for downloading chart to your storage
11. Monthly Chart Panel
Panel for showing monthly chart of your AOI
12. Legend Panel
Panel to know the meaning of the colors in the shown image
13. Inspector Tool
Tool for assessing monthly chart in a pixel or point
14. Close Inspector Button
Button for closing inspector tool and removing the point chart
15. Refresh Panel Button
Button to refresh all main panel and start assessing different data
Start Assessing
A. Draw AOI
Draw or make your Area Of Interest (AOI) in the map canvas to your preferrable area
Drawing Tool Description
1. Pan Tool
Geometry tool for dragging map view and select geometry on the map
2. Point Tool
Geometry tool for making a Point of Interest (POI)
3. Line Tool
Geometry tool for makina a line geometry (not so much used in the app)
4. Polygon Tool
Geometry tool for making an AOI with polygon-shaped
5. Rectangular Tool
Geometry tool for making an AOI with rectangular-shaped
6. Geometry Layer Panel
Panel for managing geometry layer such as showing/hiding/deleting geometry
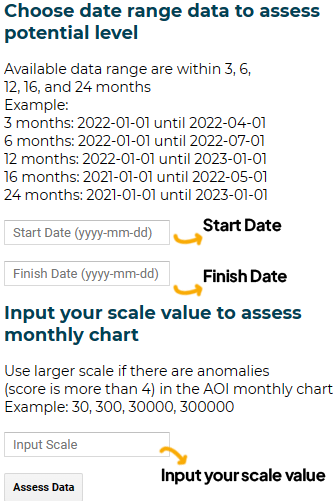
B. Input Range-Scale and Assess
Range are added in the date input box. Range is used for assessing data in a certain time based on your start date and finish date input.
Scale input is used for specifying the size of the pixel resolution to assess in a certain area.
Notes:
> Date format is in YYYY-MM-DD.
> Timeseries animation can only be shown if your date range is in 3, 6, 12, 16, and 24 months.
> The bigger scale, can be the solution if your monthly chart shows anomolies (PFZ Score is more than 4)
> The bigger scale can cause an error in assessing monthly chart, so be careful.
C. Assess Certain Pixel
1. Click on the Inspector Tool Button
2. Click a certain point on the image shown in the map canvas
3. Chart will show in the main panel
4. Close inspector tool by clicking the Close Inspector Button
5. Choose Inspector Tool again and click on a certain point or pixel of the image shown again
D. Assessing Again (Optional)
1. Move or delete your AOI using Pan Tool
2. Make or draw your AOI again in your preferable area
3. Choose Refresh Panel Button in the main panel
4. Input your new data range if needed and choose Assess Data Button
Download Chart Data
Chart data can be downloaded by clicking the download button in the upper right of the chart. Data can be downloaded into *.csv, *.svg, and *.png format.
Reference
Reference used in this project
Journal bibliography
Kuhn, C., de Matos Valerio, A., Ward, N., Loken, L., Sawakuchi, H. O., Kampel, M., Richey, J., Stadler, P., Crawford, J., Striegl, R., Vermote, E., Pahlevan, N., & Butman, D. (2019). Performance of Landsat-8 and Sentinel-2 surface reflectance products for river remote sensing retrievals of chlorophyll-a and turbidity. Remote Sensing of Environment, 224, 104-118. https://doi.org/10.1016/j.rse.2019.01.023
Parwati, E., & Purwanto, A. D. (2017). Time series analysis of total suspended solid (TSS) using Landsat data in Berau coastal area, Indonesia. International Journal of Remote Sensing and Earth Sciences, 14(1), 61-70.
Prabiantissa, C. N., Basuki, A., & Sesulihatien, W. T. (2019). Observation of fish dissemination pattern on madura coastal using segmentation ofSatellite images. EMITTER International Journal of Engineering Technology, 7(1), 343-363. https://emitter2.pens.ac.id/ojs/index.php/emitter/article/view/383/146.
Supriatna, L., Supriatna, J., Koetsoer, R. H., & Takarina, N. D. (2016). Algorithm model for the determination of Cimandiri Estuarine boundary using remote sensing. AIP Conference Proceedings. https://doi.org/10.1063/1.4946982.
Issues
If you have any issue please contact fakmalpradana@mail.ugm.ac.id or hyatma.a.a@mail.ugm.ac.id